JDK命令
大约 3 分钟
JDK命令
JDK内置调优工具
JPS
虚拟机进程状况工具
jps
usage: jps [-help]
       jps [-q] [-mlvV] [<hostid>]

Definitions:
    <hostid>:      <hostname>[:<port>]
jmap
Java内存映像工具
# 查看帮助信息
jmap -help
Usage:
    jmap -clstats <pid>
        to connect to running process and print class loader statistics
    jmap -finalizerinfo <pid>
        to connect to running process and print information on objects awaiting finalization
    jmap -histo[:live] <pid>
        to connect to running process and print histogram of java object heap
        if the "live" suboption is specified, only count live objects
    jmap -dump:<dump-options> <pid>
        to connect to running process and dump java heap
    jmap -? -h --help
        to print this help message

    dump-options:
      live         dump only live objects; if not specified,
                   all objects in the heap are dumped.
      format=b     binary format
      file=<file>  dump heap to <file>

    Example: jmap -dump:live,format=b,file=heap.bin <pid>

# dump堆内存
jmap -dump:live,format=b,file=heap.dump <pid>
除了使用jmap命令,还可以通过以下方式:
1、使用 jconsole 选项通过 HotSpotDiagnosticMXBean 从运行时获得堆转储(生成dump文件)、
2、虚拟机启动时如果指定了 -XX:+HeapDumpOnOutOfMemoryError 选项, 则在抛出 OutOfMemoryError 时, 会自动执行堆转储。
3、使用 hprof 命令
jstack
jstack主要用来查看某个Java进程内的线程堆栈信息
# 查看帮助信息
jstack -help
Options:
    -l  long listing. Prints additional information about locks 会打印出额外的锁信息,在发生死锁时可以用jstack -l pid来观察锁持有情况
    -e  extended listing. Prints additional information about threads
    -? -h --help -help to print this help message
jstat
JVM统计监测工具
# 查看帮助信息
jstat -help
Usage: jstat --help|-options
       jstat -<option> [-t] [-h<lines>] <vmid> [<interval> [<count>]]

Definitions:
  <option>      An option reported by the -options option
  <vmid>        Virtual Machine Identifier. A vmid takes the following form:
                     <lvmid>[@<hostname>[:<port>]]
                Where <lvmid> is the local vm identifier for the target
                Java virtual machine, typically a process id; <hostname> is
                the name of the host running the target Java virtual machine;
                and <port> is the port number for the rmiregistry on the
                target host. See the jvmstat documentation for a more complete
                description of the Virtual Machine Identifier.
  <lines>       Number of samples between header lines.
  <interval>    Sampling interval. The following forms are allowed:
                    <n>["ms"|"s"]
                Where <n> is an integer and the suffix specifies the units as
                milliseconds("ms") or seconds("s"). The default units are "ms".
  <count>       Number of samples to take before terminating.
  -J<flag>      Pass <flag> directly to the runtime system.
  -? -h --help  Prints this help message.
  -help         Prints this help message.

  # 查看gc情况
  jstat -gc <pid>
jhat
jhat也是jdk内置的工具之一。主要是用来分析java堆的命令,可以将堆中的对象以html的形式显示出来,包括对象的数量,大小等等,并支持对象查询语言。
jhat -J-Xmx512M heap.dump

说明:有时dump出来的堆很大,在启动时会报堆空间不足的错误,可加参数:jhat -J-Xmx512m <heap dump file>。这个内存大小可根据自己电脑进行设置。
jinfo
全称Java Configuration Info,所以它的主要作用是实时查看和调整JVM配置参数
# 查看帮助信息
jinfo -help
Usage:
    jinfo [option] <pid>
        (to connect to running process)
    jinfo [option] <executable <core>
        (to connect to a core file)
    jinfo [option] [server_id@]<remote server IP or hostname>
        (to connect to remote debug server)

where <option> is one of:
    -flag <name>         to print the value of the named VM flag
    -flag [+|-]<name>    to enable or disable the named VM flag   开启或者关闭对应名称的参数
    -flag <name>=<value> to set the named VM flag to the given value 设置参数
    -flags               to print VM flags 输出全部的参数
    -sysprops            to print Java system properties 输出当前 jvm 进行的全部的系统属性
    <no option>          to print both of the above
    -h | -help           to print this help message
jcmd
在JDK1.7以后,新增了一个命令行工具 jcmd。他是一个多功能的工具,可以用它来导出堆、查看Java进程、导出线程信息、执行GC、还可以进行采样分析(jmc 工具的飞行记录器)
# 查看 当前机器上所有的 jvm 进程信息
jcmd 、jcmd -l和jps等效
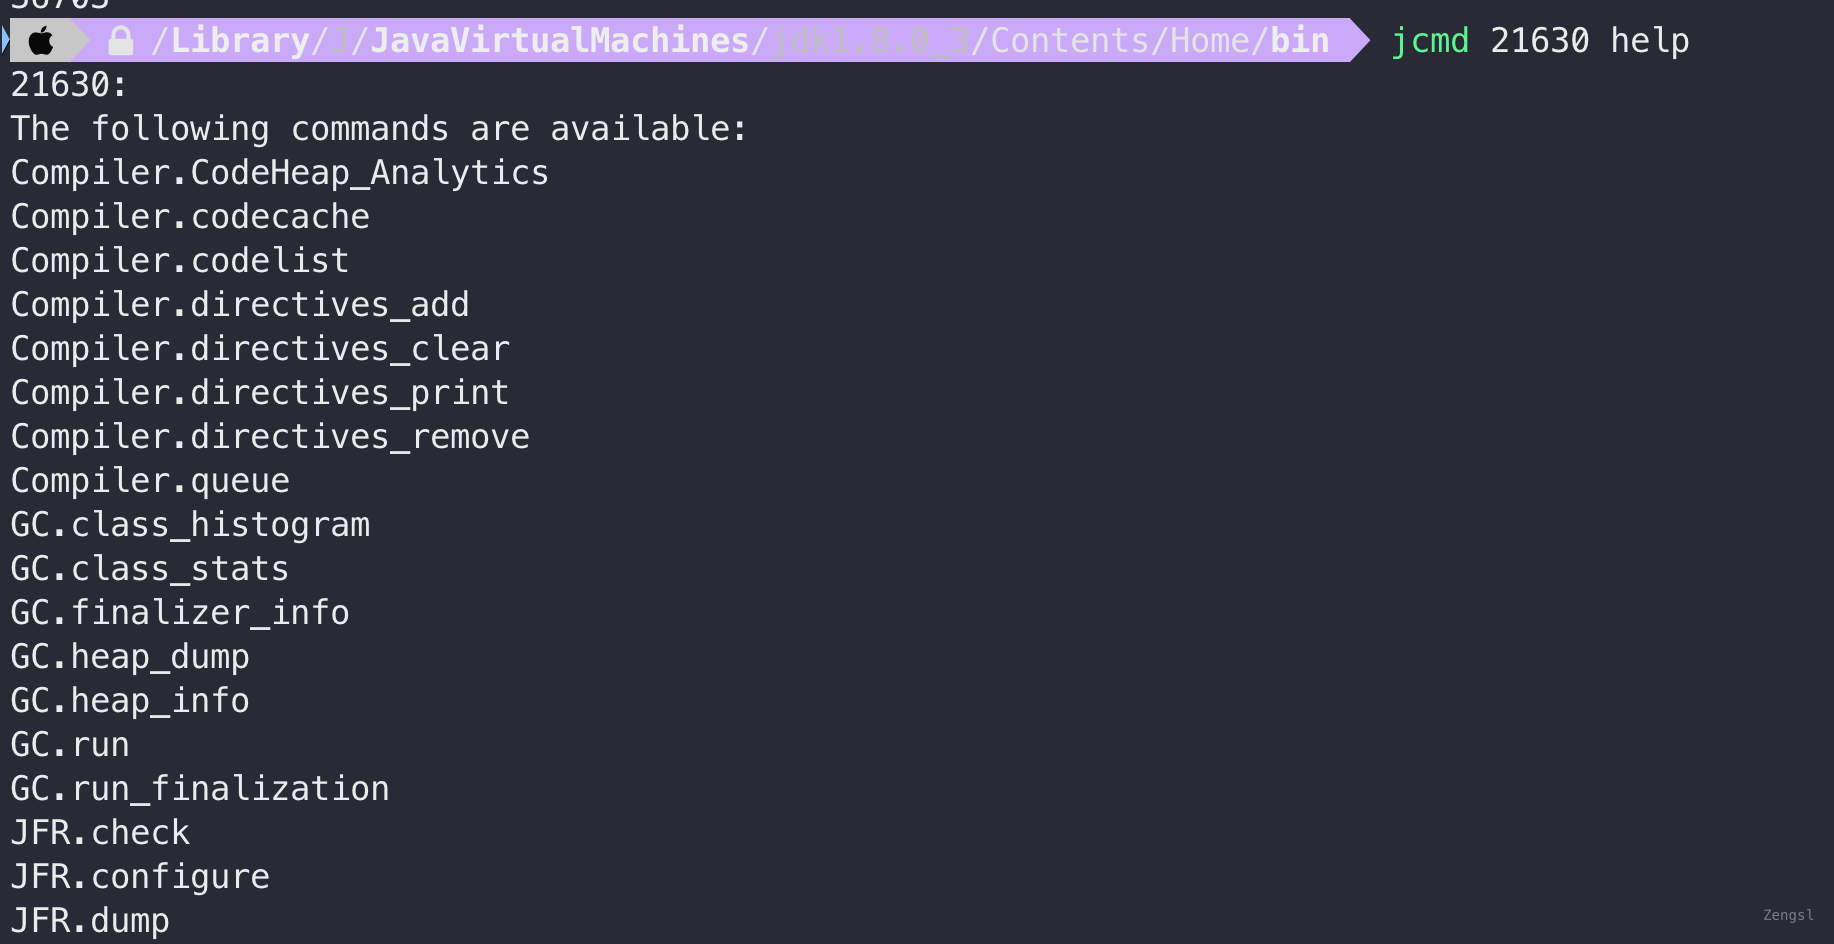
执行jcmd PID help 列出当前运行的 java 进程可以执行的操作
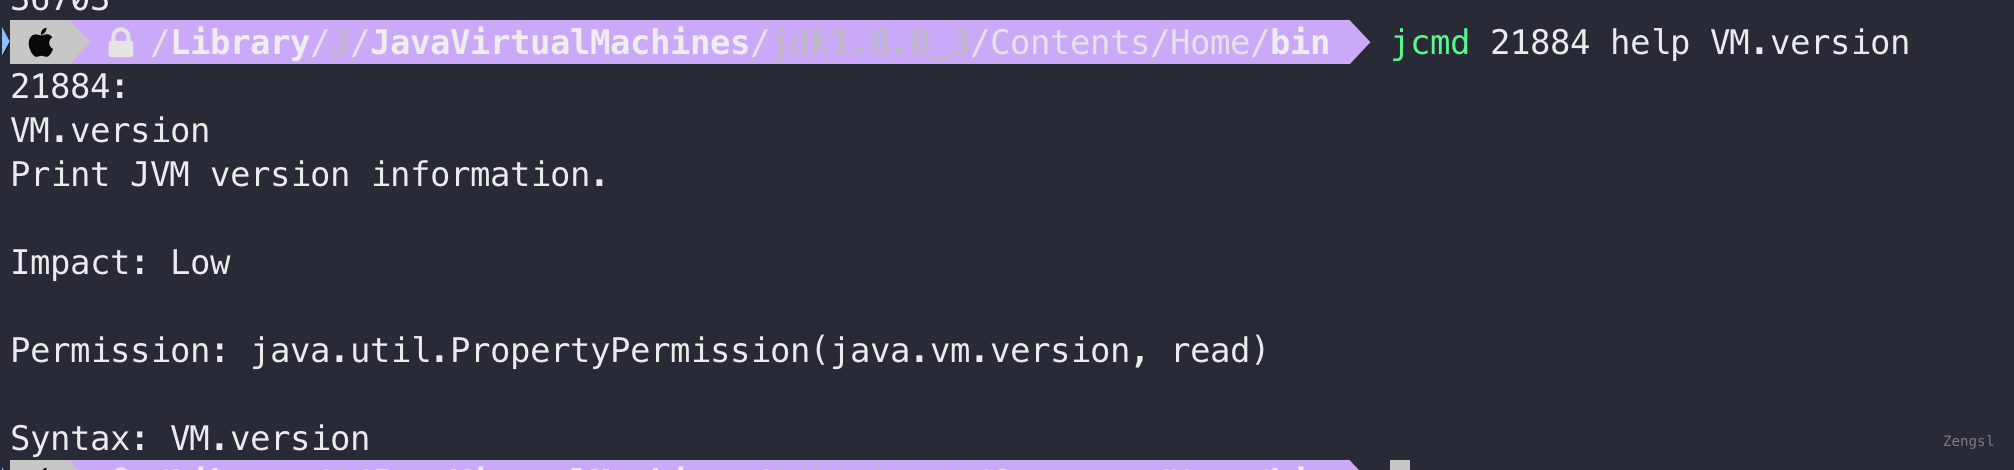
执行jcmd PID help VM.version
查看线程信息jcmd PID Thread.print
查看 JVM 的Heap Dump:jcmd PID GC.heap_dump FILE_NAME
等其他功能可以参考https://cloud.tencent.com/developer/article/1130026
jrockit相关命令
# dump内存
jrcmd <pid> hprofdump filename=/home/tomcat/test.hprof
# 打印线程
jrcmd.exe <pid> print_threads
# 打印参数
jrcmd <pid> print_properties
其他监控工具
jconsole
jvisualvm
jmc
jprofile
arthas
监控方法
# 带条件
watch org.dom4j.tree.QNameCache get "{params,target,returnObj}" 'params[0] instanceof String ' -x 2 b